User Tools
Sidebar
Pie Bars Graphics
In the Android and iOS Frameworks, it is possible to represent a content in graphic form, this one can be of several types.
| Types of Graphics by platform | |
|---|---|
| Android | Bars (barchart,3dbarchart,slidingbarchart), Pie (piechart,piechart2), Time series (timeserieschart) and lines (linechart,xylinechart) |
| iOS (Iphone e Ipad) | Pie (piechart), Half Pie (halfpiechart) |
Types of Graphics
| 1.- Bars Chart. viewmode=“barchart” | 2.- 3D Bars. viewmode=“3dbarchart” | 3.- Design Sliding Bars. viewmode=“slidingbarchart” |
|---|---|---|
 |  |  |
| 4.- Pie Chart. viewmode=“piechart” | 5.- Alternative Pie. viewmode=“piechart2” | 6.- Time line. viewmode=“timeserieschart” |
 |  |  |
| 7.- Lines Chart. viewmode=“linechart” | 8.- XY Lines Chart. viewmode=“xylinechart” | |
 |  |
For its use in Android, it is necessary to download and install the plugin xonecharts, available at xonesupport.
Mappings Code
The heading collection will be an “special” collection with no SQL nor associated DB table. It will have the prop of the call to the contents collection by telling it the visualization way desired for the graphic.
1.- Attributes in the Heading collection
| Attribute | Level | Description |
|---|---|---|
| special=“true” | Coll | It indicates that this collection is a special one, that do not read anything from DB. |
| notab=“true” | Coll | For not taking tabs at the upper side and we have available the full screen. |
| classid=“xonecharts” | Prop of call to contents | It instantiates to the plugin from the graphics. |
| viewmode=“barchart” | Prop of call to contents | Type of graphic we desire, the available types are: “barchart”, “3dbarchart”, “slidingbarchart”, “piechart”, “piechart2”, “timeserieschart”, “linechart”, “xylinechart”, “halfpiechart” (iPhone/iPad only) |
| width=“100%” | Prop of call to contents | Graphic width on screen |
| height=“100%” | Prop of call to contents | Graphic height on screen |
| mask=“0” | Prop of call to contents | For not touching anything |
Regarding the Contents collection, that is the one that will have the data and in each of the props we will have to put different attributes to define the values of the Series and Categories (Bar Charts) to feed the graphic.
2.- Attributes in the Contents collection
| Attribute | Level | Description |
|---|---|---|
| dependent=“false” and check-owner=“false” | Coll | To indicate the machinery that the contents has no field linked to the “heading”, that it is independent and do not try to link to this one. |
| chart-serie-title=“true” and chart-serie=“true” | Prop | It is applies to the prop that defines the values of the X axis series. |
| chart-category=“true” | Prop | It is applied to the prop that defines the value of each one of the bars of a series (Bar Charts only) |
| chart-category-color=“#FF0000” | Prop | It is applied to the prop that define the values of the categories for the bar charts. If no prop is defined with this atribute, a random color will be established. |
| chart-serie-color=“true” | Prop | It is applied to the prop that defines the value of the color, for the pie charts or lines. If no prop is defined with this attribute, a random color will be established. |
| chart-max-visible-columns=“3” | Prop | To define the number of series to show simultaneously, through an sliding bar at the upper side, we are browsing the different series (X Axis), that we have defined. (Sliding only) |
Bar Chart
In a bar chart, the series correspond to the values of the X axis, nevertheless, these ones can be broken down in turns into Categories (Bars).
| Explanation Series and Categories in Bar Charts. |
|---|
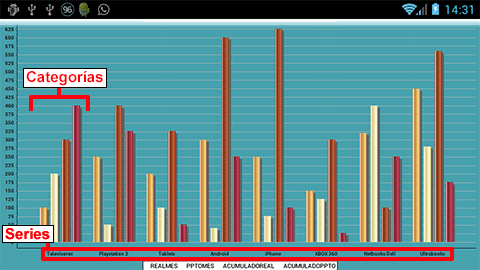 |
Example of Bars
<coll name="GraficoDeBarrasDiseno01" special="true" sql-debug="true" notab="true" autorefresh="true" title="Gráfico de barras" sql="" objname="" updateobj="" progid="ASData.CASBasicDataObj">
	<group name="General" id="1" imgbk="fondo_cielo.png" />
	<prop name="@ObjetivosFamiliasBarras" group="1" classid="XOneCharts" viewmode="barchart" type="Z" contents="ObjetivosFamiliasBarras" width="100%" height="100%" mask="0" />
	<contents name="ObjetivosFamiliasBarras" src="ObjetivosFamiliasBarras" />
	<onback>
		<action name="runscript">
			<script language="VBScript">
				appdata.FailWithMessage -11888, "##EXIT##"
			</script>
		</action>
	</onback>
</coll>
<coll name="ObjetivosFamiliasBarras" fontsize="8" title="ObjetivosfamiliasBarras" objname="ObjetivosFamilias" updateobj="ObjetivosFamilias" progid="ASData.CASBasicDataObj"
sql="SELECT t1.ID,t1.FAMILIA,t1.REALMES,t1.PPTOMES,t1.ACUMULADOREAL,t1.ACUMULADOPPTO
FROM ##PREF##ObjetivosFamilias t1" dependent="false" check-owner="false">
	<group name="General" id="1" />
	<prop name="FAMILIA" type="T" chart-serie-title="true" visible="7" group="1" />
	<prop name="REALMES" type="N2" chart-category="true" chart-category-color="#FF0000" title="Vencimiento" visible="7" group="1" />
	<prop name="PPTOMES" type="N2" chart-category="true" chart-category-color="#FFFF00" title="Importe" visible="7" group="1" />
	<prop name="ACUMULADOREAL" type="N2" chart-category="true" chart-category-color="#00FF00" title="Imp.Abierto" visible="7" group="1" />
	<prop name="ACUMULADOPPTO" type="N2" chart-category="true" chart-category-color="#0000FF" title="Rec.Pagare" visible="7" group="1" />
</coll>
NOTE: onback is an Android exclusive node to control the pressing of the “Back” button.
3D Bar Charts 3D
It is similar than the previous one regarding the code. The difference lies in the viewmode=“3dbarchart” attribute in the heading collection that calls to the contents where the data are defined in.
The contents that defines the data which feed the chart IT IS THE SAME ONE for all the bar charts.
| Explanation Series and Categories in 3D Bar Chart. |
|---|
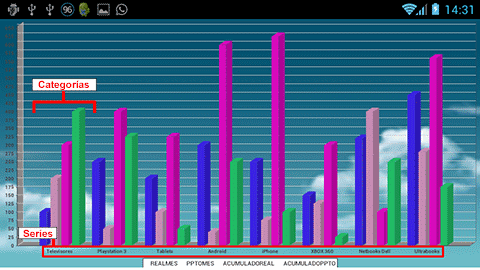 |
Example 3D Bars
<coll name="GRAFICODEBARRAS3D" special="true" sql-debug="true" notab="true" autorefresh="true" sql="" objname="" updateobj="" progid="ASData.CASBasicDataObj">
	<group name="General" id="1" imgbk="fondo_cielo.png" />
	<prop name="@ObjetivosFamiliasBarras" group="1" classid="XOneCharts" viewmode="3dbarchart" type="Z" contents="ObjetivosFamiliasBarras" width="100%" height="100%" mask="0" />
	<contents name="ObjetivosFamiliasBarras" src="ObjetivosFamiliasBarras" />
	<onback>
		<action name="runscript">
			<script language="VBScript">
				appdata.FailWithMessage -11888, "##EXIT##"
			</script>
		</action>
	</onback>
</coll>
<coll name="ObjetivosFamiliasBarras" fontsize="8" title="ObjetivosfamiliasBarras" objname="ObjetivosFamilias" updateobj="ObjetivosFamilias" progid="ASData.CASBasicDataObj"
sql="SELECT t1.ID,t1.FAMILIA,t1.REALMES,t1.PPTOMES,t1.ACUMULADOREAL,t1.ACUMULADOPPTO
FROM ##PREF##ObjetivosFamilias t1" dependent="false" check-owner="false">
	<group name="General" id="1" />
	<prop name="FAMILIA" type="T" chart-serie-title="true" visible="7" group="1" />
	<prop name="REALMES" type="N2" chart-category="true" chart-category-color="#FF0000" title="Vencimiento" visible="7" group="1" />
	<prop name="PPTOMES" type="N2" chart-category="true" chart-category-color="#FFFF00" title="Importe" visible="7" group="1" />
	<prop name="ACUMULADOREAL" type="N2" chart-category="true" chart-category-color="#00FF00" title="Imp.Abierto" visible="7" group="1" />
	<prop name="ACUMULADOPPTO" type="N2" chart-category="true" chart-category-color="#0000FF" title="Rec.Pagare" visible="7" group="1" />
</coll>
Sliding Bar Charts
Regarding the previous ones, the viewmode=“slidingbarchart” attribute changes in the heading collection that calls to the contents where the data are defined.
The contents that defines the data which feed the chart is THE SAME ONE for all the bar charts.
| Explanation Series and Categories in 3D Bar Charts. |
|---|
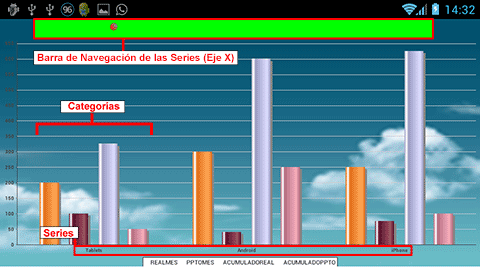 |
Regarding the sliding bar of the upper side, it is a control we are going to use for showing some series or another ones in the X axis when it is about many series that have not place in a single chart, defining the maximum number of series to show, the top navigation bar of the series will have more or less “milestones”.
1.- Attributes to remark in the prop of call to the contents
| Attribute | Description |
|---|---|
| viewmode=“slidingbarchart” | Chart type we want to, in the matter at hand, of Slide type. |
| chart-max-visible-columns=“3” | To define the number of series to show simultaneously, through an sliding bar at the top side we are browsing the different series ( X axis ), that we have defined. |
| chart-lock-x-axis=“true” | This way we can also lock the X axis, so if this attribute is not specified, besides, it can be scrolled the X Axis with the finger with no need to se the top bar. |
| chart-lock-y-axis=“true” | To avoid the scrolling by the Y Axis. |
| chart-linked-seekbar=“MAP_XONESEEKBAR” | Name of the Prop that defines the navigation bar of the chart series. |
2.- Attributes of the prop that defines the navigation bar
| Attribute | Description |
|---|---|
| viewmode=“seekbar” | It defines the behaviour of the Slide type. |
| img-thumb=“thumb.png” | Image we want to use as “bookmark” at the bar. |
| img-progress-left=“progress_left.png” | Background image of the navigation bar. |
Example of Sliding
<coll name="GRAFICODEBARRASSLIDING" special="true" group-swipe="false" sql-debug="true" notab="true" autorefresh="true" sql="" objname="" updateobj="" progid="ASData.CASBasicDataObj">
	<group name="General" id="1" imgbk="fondo_cielo.png" />
	<prop name="MAP_XONESEEKBAR" title="" type="N2" visible="1" group="1" size="255" viewmode="seekbar" lmargin="7%" width="90%" height="25" img-thumb="thumb.png" img-progress-left="progress_left.png" />
	<prop name="@ObjetivosFamiliasBarras" group="1" classid="XOneCharts" viewmode="slidingbarchart" chart-max-visible-columns="3" chart-linked-seekbar="MAP_XONESEEKBAR" Xchart-lock-x-axis="true" chart-lock-y-axis="true" xlocked="true" type="Z" contents="ObjetivosFamiliasBarras" width="100%" height="92%" mask="0" />
	<contents name="ObjetivosFamiliasBarras" src="ObjetivosFamiliasBarras" />
	<onback>
		<action name="runscript">
			<script language="VBScript">
				appdata.FailWithMessage -11888, "##EXIT##"
			</script>
		</action>
	</onback>
</coll>
<coll name="ObjetivosFamiliasBarras" fontsize="8" title="ObjetivosfamiliasBarras" objname="ObjetivosFamilias" updateobj="ObjetivosFamilias" progid="ASData.CASBasicDataObj"
sql="SELECT t1.ID,t1.FAMILIA,t1.REALMES,t1.PPTOMES,t1.ACUMULADOREAL,t1.ACUMULADOPPTO
FROM ##PREF##ObjetivosFamilias t1" dependent="false" check-owner="false">
	<group name="General" id="1" />
	<prop name="FAMILIA" type="T" chart-serie-title="true" visible="7" group="1" />
	<prop name="REALMES" type="N2" chart-category="true" chart-category-color="#FF0000" title="Vencimiento" visible="7" group="1" />
	<prop name="PPTOMES" type="N2" chart-category="true" chart-category-color="#FFFF00" title="Importe" visible="7" group="1" />
	<prop name="ACUMULADOREAL" type="N2" chart-category="true" chart-category-color="#00FF00" title="Imp.Abierto" visible="7" group="1" />
	<prop name="ACUMULADOPPTO" type="N2" chart-category="true" chart-category-color="#0000FF" title="Rec.Pagare" visible="7" group="1" />
</coll>
Pie Chart
Currently there are two models, the difference lies in the viewmode=“piechart” or viewmode=“piechart2” attributes in the heading collection that calls to the contents where the data are defined in.
The contents that defines the data which feed the chart IT IS THE SAME ONE for the two models.
Unlike the Bar Charts, we only will have simple series, we will not have categories.
| Model 1. Pie Chart (piechart) | Model 2. Pie Chart with Zoom (piechart2) |
|---|---|
| | |
Attributes of the Pie Chart contents
| Attribute | Description |
|---|---|
| chart-serie-title=“true” and chart-serie=“true” | The prop where these attribute will be placed will correspond to the titles of the different parts of the chart. |
| chart-value=“true” | It has the values to represent. |
| chart-serie-color=“true” | Colors to represent. |
Example of Pie
<!-- *****  Diseño 1. (piechart)  ***** -->
<coll name="GRAFICODEQUESODISENO01" special="true" sql-debug="true" notab="true" autorefresh="true" sql="" objname="" updateobj="" progid="ASData.CASBasicDataObj">
	<group name="General" id="1" imgbk="fondo_cielo.png" />
	<prop name="@ObjetivosFamiliasQueso" group="1" classid="XOneCharts" viewmode="piechart" type="Z" contents="ObjetivosFamiliasQueso" width="100%" height="100%" mask="0" />
	<contents name="ObjetivosFamiliasQueso" src="ObjetivosFamiliasQueso" />
	<onback>
		<action name="runscript">
			<script language="VBScript">
				appdata.FailWithMessage -11888, "##EXIT##"
			</script>
		</action>
	</onback>
</coll>

<!-- *****  Modelo 2, con Zoom. (piechart2)  ***** -->
<coll name="GRAFICODEQUESODISENO02" special="true" sql-debug="true" notab="true" autorefresh="true" sql="" objname="" updateobj="" progid="ASData.CASBasicDataObj">
	<group name="General" id="1" imgbk="fondo_cielo.png" />
	<prop name="@ObjetivosFamiliasQueso" group="1" classid="XOneCharts" viewmode="piechart2" type="Z" contents="ObjetivosFamiliasQueso" width="100%" height="100%" mask="0" />
	<contents name="ObjetivosFamiliasQueso" src="ObjetivosFamiliasQueso" />
	<onback>
		<action name="runscript">
			<script language="VBScript">
				appdata.FailWithMessage -11888, "##EXIT##"
			</script>
		</action>
	</onback>
</coll>

<!-- *****  Contents para definir los campos que rellenan el gráfico. Común para los 2 modelos.  ***** -->
<coll name="ObjetivosFamiliasQueso" title="ObjetivosFamiliasQueso" objname="ObjetivosFamiliasQueso" updateobj="ObjetivosFamiliasQueso" progid="ASData.CASBasicDataObj" sql="SELECT t1.ID,t1.TITULO,t1.VALOR,t1.COLOR
	FROM ##PREF##ObjetivosFamiliasQueso t1" filter="" sort="" dependent="false" check-owner="false">
	<group name="General" id="1" />
	<prop name="TITULO" frame="id10" chart-serie-title="true" chart-serie="true" type="T" visible="7" group="1" />
	<prop name="VALOR" frame="id10" chart-value="true" type="N2" visible="7" group="1" title="Valor" />
	<prop name="COLOR" frame="id10" chart-serie-color="true" type="T" visible="0" group="1" />
</coll>
Time Series Chart
Attribute viewmode=“timeserieschart” in the heading collection that calls to the contents where the data are defined in.
| Time Series Chart. (timeserieschart) |
|---|
| |
Attributes of the time lines contents
| Attribute | Description |
|---|---|
| chart-serie-title=“true” and chart-serie=“true” | The prop wehere these attributes are placed in, it will correspond to the titles of the different parts of the chart. |
| chart-date=“true” | It has the dates to represent. |
| chart-value=“true” | It has the values to represent. |
| chart-serie-color=“true” | Colors to represent. |
| chart-serie-line-width=“true” | It defines the line width . |
Example of Series Time
<coll name="GRAFICODETIEMPODISENO01" special="true" sql-debug="true" notab="true" autorefresh="true" sql="" objname="" updateobj="" progid="ASData.CASBasicDataObj">
	<group name="General" id="1" imgbk="fondo_cielo.png" />
	<prop name="@ObjetivosFamiliasTiempo" group="1" classid="XOneCharts" viewmode="timeserieschart" type="Z" contents="ObjetivosFamiliasTiempo" width="100%" height="100%" mask="0" />
	<contents name="ObjetivosFamiliasTiempo" src="ObjetivosFamiliasTiempo" />
	<onback>
		<action name="runscript">
			<script language="VBScript">
				appdata.FailWithMessage -11888, "##EXIT##"
			</script>
		</action>
	</onback>
</coll>
<coll name="ObjetivosFamiliasTiempo" fontsize="8" title="ObjetivosFamiliasTiempo" objname="ObjetivosFamiliasTiempo" updateobj="ObjetivosFamiliasTiempo" progid="ASData.CASBasicDataObj" sql="SELECT t1.ID,t1.SERIE,t1.PERIODO,t1.VALOR,t1.COLOR
	FROM ##PREF##ObjetivosFamiliasTiempo t1" filter="" sort="" dependent="false" check-owner="false">
	<group name="General" id="1" />
	<prop name="SERIE" frame="id10" chart-serie-title="true" chart-serie="true" type="T" visible="7" group="1" />
	<prop name="PERIODO" frame="id10" chart-date="true" type="D" visible="7" group="1" />
	<prop name="VALOR" frame="id10" chart-value="true" type="N2" visible="7" group="1" />
	<prop name="COLOR" frame="id10" chart-serie-color="true" type="T" visible="0" group="1" />
	<prop name="LINESERIEWIDTH" frame="id10" chart-serie-line-width="true" type="N2" visible="0" group="1" />
</coll>
Lines Chart
viewmode=“linechart” attribute in the heading collection that calls to the contents where the data are defined in.
| Line Chart. (linechart) |
|---|
| |
Attributes of the contents of the lines chart
| Attribute | Description |
|---|---|
| chart-serie-title=“true” and chart-serie=“true” | The prop where these attributes are placed will correspond to the titles of the different parts of the chart. |
| chart-serie-column=“true” | It indicates that the prop corresponds to a column from the X Axis. |
| chart-serie-color=“true” | Colors to represent. |
| chart-serie-line-width=“true” | It defines the width of the line. |
Example Lines Chart
<coll name="GRAFICODELINEASDISENO01" special="true" sql-debug="true" notab="true" autorefresh="true" sql="" objname="" updateobj="" progid="ASData.CASBasicDataObj">
	<group name="General" id="1" imgbk="fondo_cielo.png" />
	<prop name="@ObjetivosFamiliasLineasNormales" group="1" classid="XOneCharts" viewmode="linechart" type="Z" contents="ObjetivosFamiliasLineasNormales" width="100%" height="100%" mask="0" />
	<contents name="ObjetivosFamiliasLineasNormales" src="ObjetivosFamiliasLineasNormales" />
	<onback>
		<action name="runscript">
			<script language="VBScript">
				appdata.FailWithMessage -11888, "##EXIT##"
			</script>
		</action>
	</onback>
</coll>
<coll name="ObjetivosFamiliasLineasNormales" fontsize="8" title="ObjetivosFamiliasLineasNormales" objname="ObjetivosFamiliasLineasNormales" updateobj="ObjetivosFamiliasLineasNormales" progid="ASData.CASBasicDataObj" sql="SELECT t1.ID,t1.SERIE,t1.ENERO,t1.FEBRERO,
 	t1.MARZO,t1.ABRIL,t1.MAYO,t1.JUNIO,t1.COLOR,t1.LINESERIEWIDTH
 	FROM ##PREF##ObjetivosFamiliasLineasNormales t1" filter="" sort="" dependent="false" check-owner="false">
	<group name="General" id="1" />
	<prop name="SERIE" frame="id10" chart-serie-title="true" chart-serie="true" type="T" visible="7" group="1" />
	<prop name="ENERO" frame="id10" chart-serie-column="true" type="N2" visible="7" group="1" />
	<prop name="FEBRERO" frame="id10" chart-serie-column="true" type="N2" visible="7" group="1" />
	<prop name="MARZO" frame="id10" chart-serie-column="true" type="N2" visible="7" group="1" />
	<prop name="ABRIL" frame="id10" chart-serie-column="true" type="N2" visible="7" group="1" />
	<prop name="MAYO" frame="id10" chart-serie-column="true" type="N2" visible="7" group="1" />
	<prop name="JUNIO" frame="id10" chart-serie-column="true" type="N2" visible="7" group="1" />
	<prop name="COLOR" frame="id10" chart-serie-color="true" type="T" visible="0" group="1" />
	<prop name="LINESERIEWIDTH" frame="id10" chart-serie-line-width="true" type="N2" visible="0" group="1" />
</coll>
XY Lines Chart
viewmode=“xylinechart” attribute at the heading collection that calls to the contents where the data are defined.
| XY Lines Chart. |
|---|
| |
Attributes of the XY Lines Chart contents
| Attribute | Description |
|---|---|
| chart-serie-title=“true” and chart-serie=“true” | The prop where these attributes are will correspond to the titles of the different parts of the chart. |
| chart-serie-x=“true” | It indicates that the prop corresponds with the values of the X Axis. |
| chart-serie-y=“true” | It indicates that the prop corresponds with the Y Axis values. |
| chart-serie-color=“true” | Colors to represent. |
| chart-serie-line-width=“true” | It defines the line width. |
XY Lines Example
<coll name="GRAFICODELINEASXYDISENO01" special="true" sql-debug="true" notab="true" autorefresh="true" sql="" objname="" updateobj="" progid="ASData.CASBasicDataObj">
	<group name="General" id="1" imgbk="fondo_cielo.png" />
	<prop name="@ObjetivosFamiliasLineasXY" group="1" classid="XOneCharts" viewmode="xylinechart" type="Z" contents="ObjetivosFamiliasLineasXY" width="100%" height="100%" mask="0" chart-show-x-axis-label="false" chart-show-y-axis-label="false" />
	<contents name="ObjetivosFamiliasLineasXY" src="ObjetivosFamiliasLineasXY" />
	<onback>
		<action name="runscript">
			<script language="VBScript">
				appdata.FailWithMessage -11888, "##EXIT##"
			</script>
		</action>
	</onback>
</coll>
<coll name="ObjetivosFamiliasLineasXY" fontsize="8" title="ObjetivosFamiliasLineasXY" objname="ObjetivosFamiliasLineas" updateobj="ObjetivosFamiliasLineas" progid="ASData.CASBasicDataObj" sql="SELECT t1.ID,t1.SERIE,t1.EJE_X,t1.EJE_Y,
 	t1.COLOR,t1.LINESERIEWIDTH
 	FROM ##PREF##ObjetivosFamiliasLineas t1" filter="" sort="" dependent="false" check-owner="false">
	<group name="General" id="1" />
	<prop name="SERIE" frame="id10" chart-serie-title="true" chart-serie="true" type="T" visible="7" group="1" />
	<prop name="EJE_X" frame="id10" chart-serie-x="true" type="N2" visible="7" group="1" />
	<prop name="EJE_Y" frame="id10" chart-serie-y="true" type="N2" visible="7" group="1" />
	<prop name="COLOR" frame="id10" chart-serie-color="true" type="T" visible="0" group="1" title=" " />
	<prop name="LINESERIEWIDTH" frame="id10" chart-serie-line-width="true" type="N2" visible="0" group="1" />
</coll>
Download the example
Downloading the last version of the xonecharts.apk and the Framework from the xonesupport web.
XOne Application with all the previous examples:
http://www.xoneisp.com/XN/DemoCharts.zip
Page Tools
